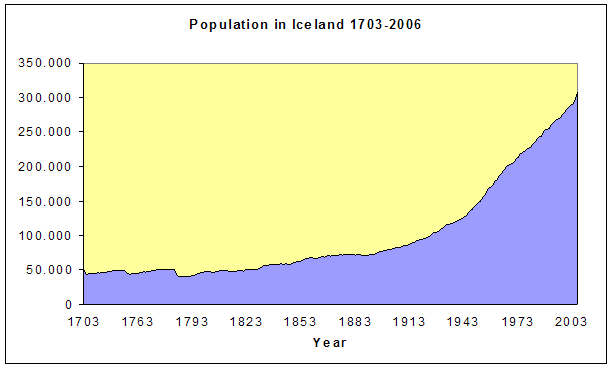
 |
|
Demography

|
Population by age and gender 31. December 2006 |
|
|
|
Total |
Male |
Female |
|
Total |
307.672 |
156.576 |
151.096 |
|
|
0 year |
4.426 |
2.264 |
2.162 |
|
|
1-14 |
61.041 |
31.109 |
29.932 |
|
|
15-64 |
206.572 |
107.038 |
99.534 |
|
|
65+ |
35.633 |
16.165 |
19.468 |
|
Source: Statistics Iceland |
|
|
|
|
|
|
|
Population by area and gender 31. December 2006 |
|
|
|
Total |
Male |
Female |
|
Total |
307.672 |
156.576 |
151.096 |
|
|
The Capital area |
191.919 |
95.591 |
96.328 |
|
|
Other |
115.753 |
60.985 |
54.768 |
|
Source: Statistics Iceland |
|
|
|
|
|
|
|
Population by gender 1. July 2006 |
|
|
|
Total |
Male |
Female |
|
|
304,334 |
154,287 |
150,047 |
|
Source: Statistics Iceland |
|
|
|
|
|
|
|
Live births 2001-2006 |
|
|
|
Total |
Boys |
Girls |
|
|
2001-2005 |
4,159 |
2,125 |
2,035 |
|
|
2006 |
4,280 |
2,183 |
2,097 |
|
The 5-year's periods show annual means. |
|
Source: Statistics Iceland |
|
|
|
|
|
|
|
Fertility and reproduction rates 2001-2005 |
|
|
Total
fertility
rate |
Repro-
duction
rate, gross |
Repro-
duction
rate, net |
|
|
|
1,991 |
0,974 |
0,966 |
|
Total number of live births a woman could have during her reproductive
life if she was exposed to the fertility rates for each age-group
experienced during that year or period. |
|
Reproduction rate, gross: Number of daughters that a woman would bear during her reproductive life assuming that the age-of-mother specific birth rates experienced during that year continue to apply. |
|
Reproduction rate, net: Gross reproduction rate assuming in addition that mortality rates experienced during that year continue to apply. |
|
Source: Statistics Iceland |
|
|
|
|
|
|
|
The number of deaths and crude death rate by sex 2001-2005 |
|
|
|
Number |
Per 1,000
inhabitants
|
|
|
|
|
|
|
Total |
9.033 |
6,2 |
|
|
|
Male |
4.669 |
6,4 |
|
|
|
Female |
4.364 |
6,0 |
|
|
Source: Statistics Iceland |
|
|
|
|
|
|
|
Life expectancy (in years) at birth 2006 |
|
|
|
Male |
Female |
|
|
|
79.4 |
83.0 |
|
Source: Statistics Iceland
Back to Economy
|
|
|


