Risk of Poverty and Income Distribution
Risk of poverty is low in Iceland. According to the Statistics on Income and Living Conditions
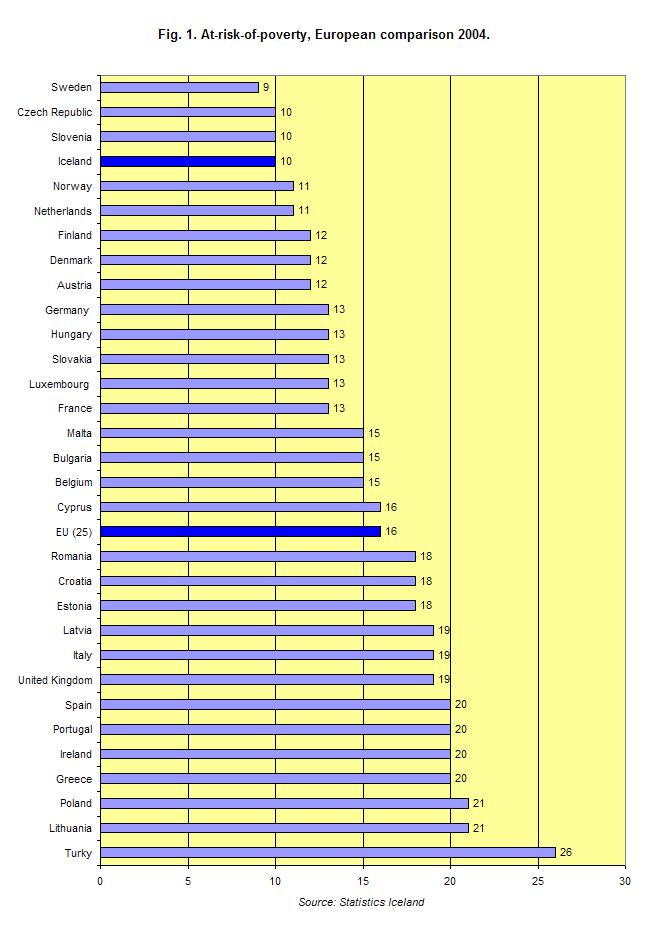
in the EU, (the EU-SILC definition) 10% of the Icelandic population living in private households were at risk
of poverty in 2004. 15.4% of persons aged 1624 were at risk of poverty and 5.9% of persons aged 5064
years old. A higher percentage of persons who live alone are at risk of poverty than of persons living with
others. The same applies to persons living in rented accommodations compared to persons living in their own
homes.
The risk of poverty rate in
Iceland is low and the income quintile share ratio shows that persons
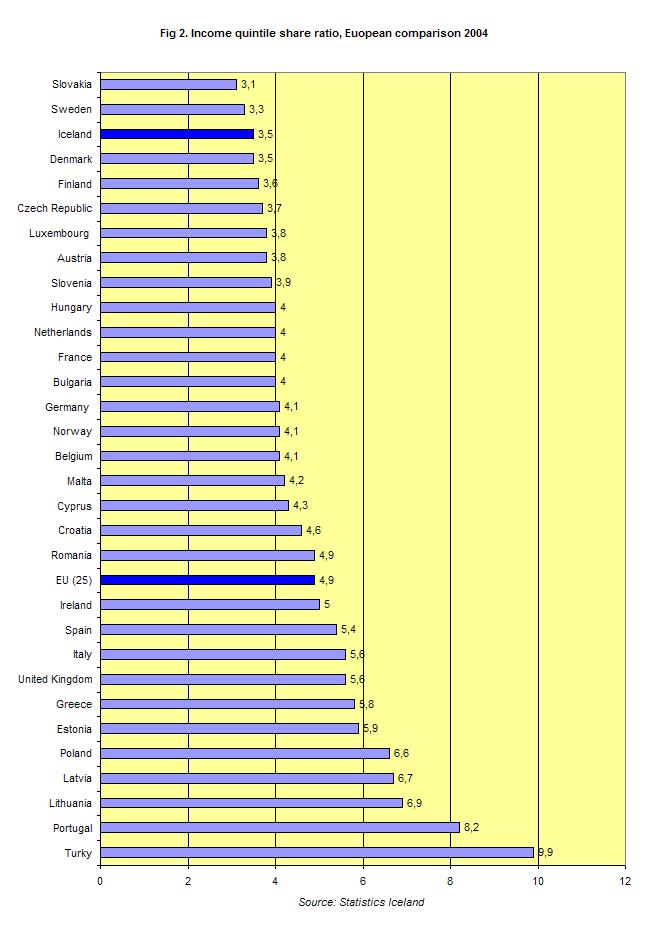
in the top income quintile had 3.5 times the equivalised income of those in the bottom income quintile and by
the Gini-coefficient was 0.25 in 2004. The standard of living in Iceland is
therefore high and even compared to European countries and has come a long way.
The
EC uses a method of relativity in order to assess the number of those below a given threshold at any given
point in time. This threshold is called at risk of poverty and was set at 60% of the median equalized income.
Those whose income is below that threshold are considered to be "at-risk-of-poverty".
This figure is calculated for each individual. In a home housing several individuals, you need a
higher income to achieve a comparable standard of living. In order to assess the impact of the size factor of
a home, you have to calculate the consumption units for each home. Let's look at a four-person family, with
two individuals 14 years of age or older, and two under 14, the home gets the balance 2.1 (1,0 + 0,5 + 0,3 + 0,3 = 2,1). Thus, the two adults
in question raising two children must have an income amounting to ISK 359,325 (2.1 * ISK 171,107)
in order to achieve a comparable standard of living as an individual in 2004.
Of 31 European nations,
one nation had a lower at risk-of-poverty rate than Iceland, two had the same rate and 27 countries had a
higher rate.

The income quintile
share ratio measures the ratio between the total of income per consumption unit for the top 20% of individuals
and the income of the bottom 20% of individuals. The income quintile share ratio demonstrates that the
20% top individuals in 2004 had a 3.5 times higher income per consumption unit than those in the bottom 20%.
Information about the income quintile share ratio is
available for 31 European states. Two of those, i.e. Slovenia and Sweden, have a lower ration than Iceland,
while the other 28 have a higher one. The lowest ratio is to be found in Slovenia, while the highest one
belongs to Turkey.

The so-called Gini
ratio shows how the income is distributed among the inhabitants. It would amount to 1 if all income belonged
to the same individual while others had nothing, whereas it would be 0 if everybody had the same income.
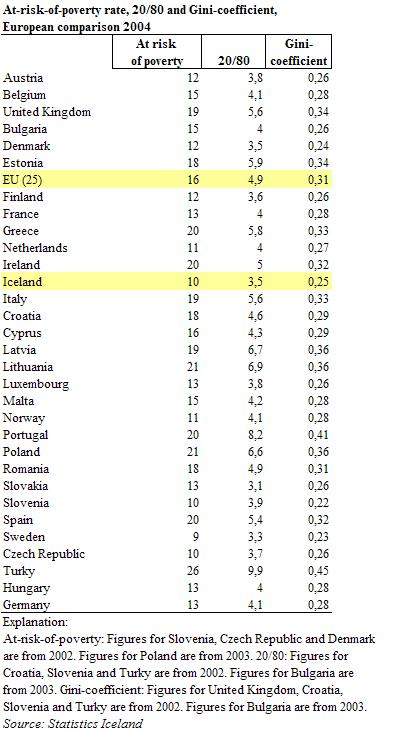
Icelands Gini ration amounted to 0.25 in 2004, compared to 0.24 in 2003. The Gini ratio is different from
the quintile share ratio as it takes all figures into account, while the quintile share ratio only uses the
top and bottom 20%.
Let us consider European comparison. Three European countries had a Gini ratio
lower than that of Iceland in 2004, while 27 countries had a higher one. The lowest Gini ratio was found in
Slovenia, while the highest was recorded in Turkey. Among neighbouring countries, Sweden and Denmark had a
lower Gini ratio than Iceland, while Finland, Norway, Ireland and the U.K. had a higher one.
Finally, the distribution of income in Iceland is very even comparison to other
European countries.

Living in Iceland
|


